

HOW WE WORK
Our Methodology
Four connected stages, shaped with your team from diagnosis through lasting use.
FROM DIAGNOSIS TO LASTING USE
Four connected stages. Your team shapes every step.
Select a stage to see the work, what you receive and how we decide together.
STAGE 01 / DIAGNOSE
“If you can’t see the handoff, you can’t fix the work.”
Find the underlying causes by studying the work, the information behind it and the people doing it.
WHAT WE FOCUS ON
-
Map the work and its handoffs.
-
Review the tools, measures and systems behind decisions.
-
Understand the roles and capabilities needed to run the work.
PRIMARY DELIVERABLE
Diagnostic report
A grounded view of root causes, evidence and priorities.
WITH YOUR TEAM
Confirm the problem we are solving and choose where to focus.
THE WORK AND WHAT IT PRODUCES
Diagnose offerings
See the full path of work before changing a step within it.
SIPOC
Define suppliers, inputs, process, outputs and customers so the scope and boundaries are clear.
Level 1 mapping
See each process at a high level: the handoffs, people involved and what flows where.
Level 2 mapping
Trace the systems, tools and communication methods within each process and between processes.
Standard operating procedures
Document the steps, responsibilities and decision points teams use to carry out the work.
RELEVANT DELIVERABLES
-
SIPOC map
-
Level 1 and Level 2 process maps
-
Standard operating procedures
-
Examine the practical decision-making layer that helps people see, discuss and act on the work.
Dashboards
Spreadsheets
Meeting structures
Decision routines
RELEVANT DELIVERABLES
-
Decision-tool inventory
-
Tool and meeting recommendations
-
Connect operating measures to executive decisions, including a CFO’s view of performance.
CFO dashboard
Review KPIs, trend lines, charts and graphs that show operating and financial performance together.
Leading and lagging
Separate indicators of what may happen next from measures of what has already happened.
Efficiency and effectiveness
Distinguish how resources are used from whether the intended outcome was achieved.
RELEVANT DELIVERABLES
-
Executive metric review
-
KPI definitions and gaps
-
Dashboard outline
-
Trace where information starts, moves, changes hands and becomes a decision.
RELEVANT DELIVERABLES
-
Current-state systems map
-
Integration and handoff findings
-
A people and talent diagnostic that examines roles, capacity and the capabilities the work requires.
RELEVANT DELIVERABLES
-
Role and capability view
-
Talent diagnostic findings
-
STAGE 02 / SPRINT
“One business can’t run on five versions of the future.”
Bring the evidence into one view, choose useful measures and connect improvement opportunities to value.
WHAT WE FOCUS ON
-
Align the baseline and the measures that matter.
-
Compare opportunities against the operating evidence.
-
Agree what value means before choosing the next work.
PRIMARY DELIVERABLE
Measures and value model
A shared view of priorities, measures and the value behind them.
WITH YOUR TEAM
Agree which measures matter and where to focus.
FOCUSED OPERATING QUESTIONS
Sprint offerings
Each Sprint examines six operating domains, following each tension through a question, evidence, measures and an economic choice. These visuals show possible deliverable formats; the focus is shaped with your team.
ONE METHOD ACROSS SIX DOMAINS
Follow the question through to a decision.
Test causes across People, Process and Technology—including data, tools and systems—before valuing a change.
01
Domain & tension
02
Question to test
03
Evidence & signal
04
Economic choice
Reconcile demand, supply, production, deployment, logistics and finance before committing to one plan.
OPERATING SPINE
Demand
Supply
Production
Deployment
Logistics
Finance

QUESTION TO TEST
Where do the demand, supply and financial versions of the plan diverge?
EVIDENCE
Forecasts and actuals; supplier receipts; schedule changes; inventory by node.
SIGNALS
Forecast bias, lead-time variation, schedule attainment, plan divergence.
DECISION & VALUE
Test service, cash and margin tradeoffs before agreeing an owned plan.
EXAMPLE DELIVERABLE FORMATS
-
Forecast bias and override view
-
Supply and capacity exception map
-
Operating-to-financial plan bridge
-
Make category and supplier choices from decision-grade spend, total cost and performance evidence.
OPERATING SPINE
Spend visibility
Category / demand
Supplier structure
Price / terms
Buying channel
Performance

QUESTION TO TEST
Which spend is truly addressable without weakening service or resilience?
EVIDENCE
AP and PO lines; supplier and item masters; contracts; landed cost; supplier performance.
SIGNALS
Spend coverage, concentration, price variance, contract leakage, supplier OTIF.
DECISION & VALUE
Separate negotiable terms from specification, compliance and supply-risk choices.
EXAMPLE DELIVERABLE FORMATS
-
Spend cube and category opportunity view
-
Supplier risk–value portfolio
-
Total-cost and performance scorecard
-
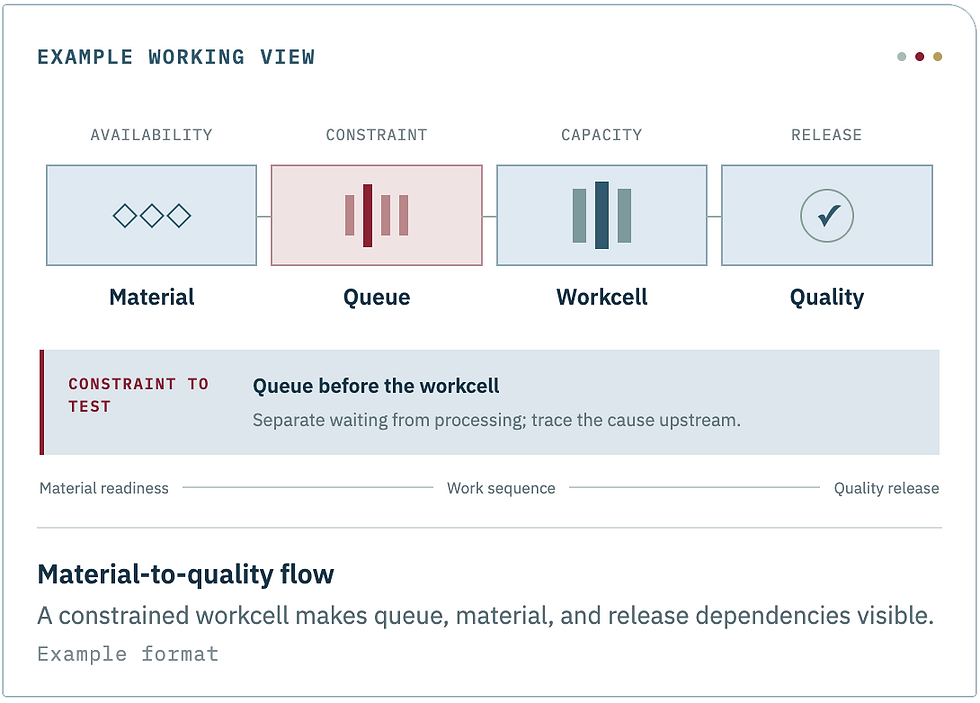
Find where materials, labor, equipment, flow, quality or maintenance consume usable capacity.
OPERATING SPINE
Materials
Labor
Equipment
Flow / schedule
Quality
Maintenance
QUESTION TO TEST
Where is productive capacity actually being lost?
EVIDENCE
Shortage and kit logs; demonstrated rates; downtime; queues; rework; maintenance history.
SIGNALS
Material availability, schedule attainment, OEE loss, WIP days, first-pass yield.
DECISION & VALUE
Test loss recovery at the constraint before buying more capacity.
EXAMPLE DELIVERABLE FORMATS
-
Current-state value-stream map
-
Constraint and capacity-loss tree
-
Quality and maintenance cause view
-
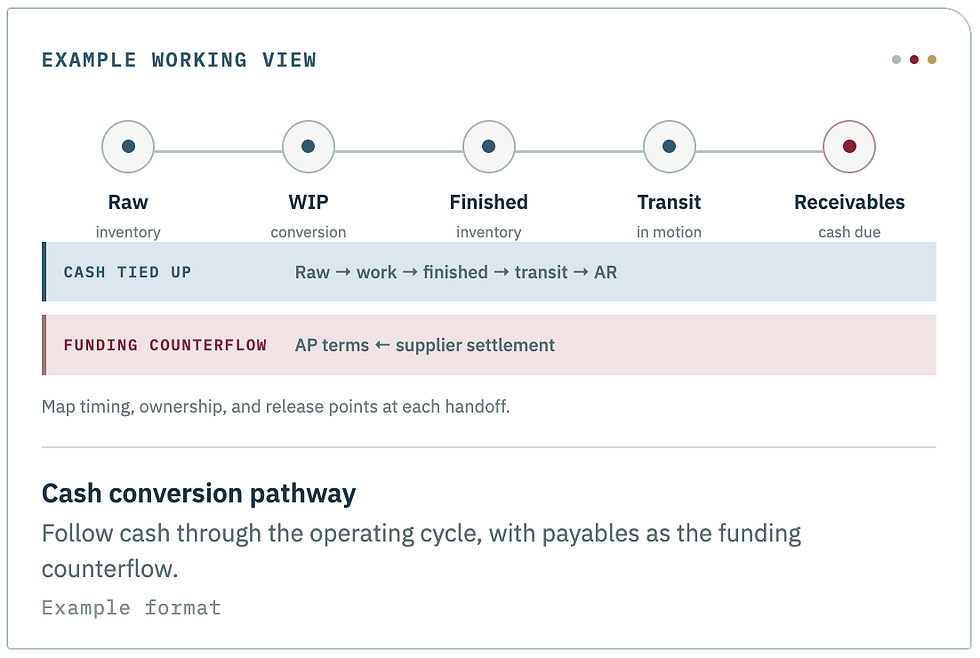
Trace cash through raw materials, work in process, finished goods, transit and the AR/AP interface.
OPERATING SPINE
Raw materials
WIP
Finished goods
In-transit
Excess / obsolete
AR / AP
QUESTION TO TEST
What cash is tied up by policy, delay or defect rather than service need?
EVIDENCE
Stock age and purpose; WIP queues; transit choices; invoice and dispute history.
SIGNALS
DIO, queue time, aged stock, dispute aging, DSO and DPO.
DECISION & VALUE
Qualify capturable cash while protecting service and revenue.
EXAMPLE DELIVERABLE FORMATS
-
Inventory-aging and cash-driver view
-
WIP queue and network map
-
Cash-conversion and AR/AP handoff map
-
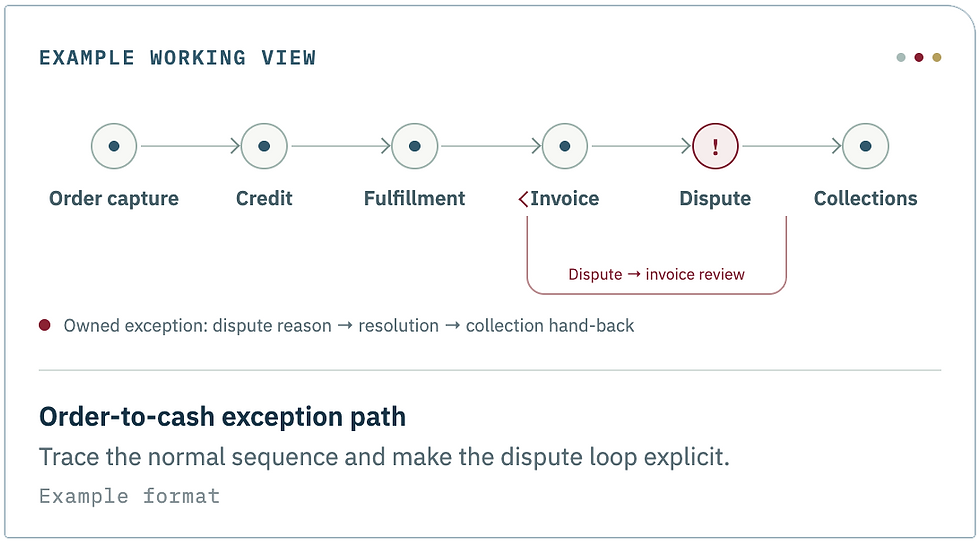
Follow commercial and operational evidence from order capture to applied cash.
OPERATING SPINE
Order capture
Credit / release
Fulfillment
Invoice
Dispute / deduction
Collections / cash
QUESTION TO TEST
Which upstream defect delays a clean invoice and applied cash?
EVIDENCE
Order and pricing errors; credit holds; proof of delivery; invoice and dispute history.
SIGNALS
First-time-right, hold aging, bill lag, dispute recurrence, unapplied cash.
DECISION & VALUE
Test an owned process fix against cash, revenue and risk.
EXAMPLE DELIVERABLE FORMATS
-
Order-to-cash handoff map
-
Invoice and dispute cause view
-
Receivables aging and cash-application view
-
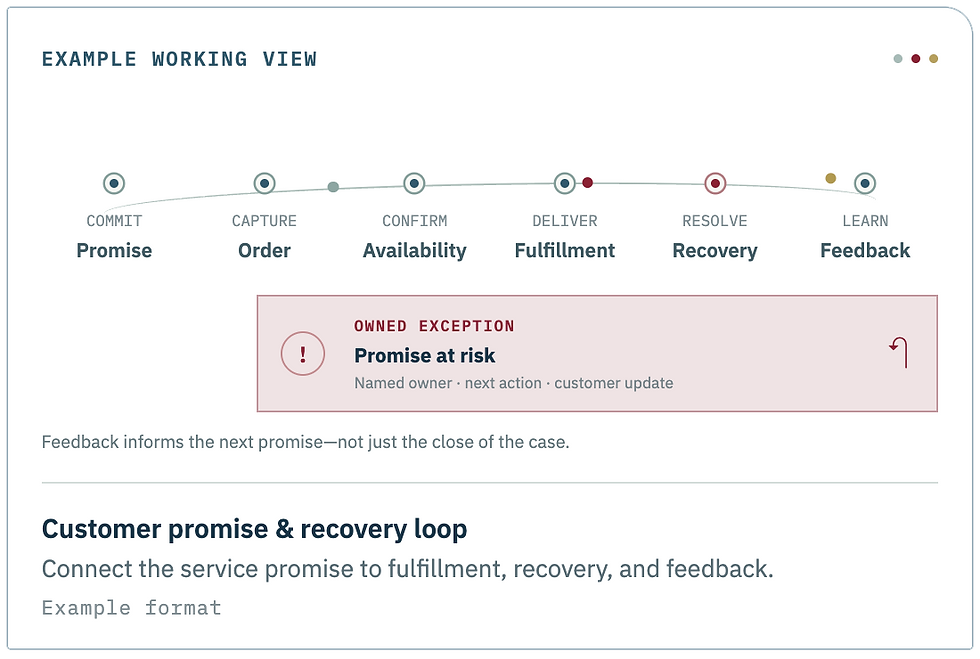
Connect the customer promise to availability, fulfillment, recovery and learning.
OPERATING SPINE
Promise
Order entry
Allocation
Fulfillment
Recovery
Feedback
QUESTION TO TEST
When does a customer promise become at risk, and who owns recovery?
EVIDENCE
Promise versions; availability rules; order holds; delivery exceptions; complaint causes.
SIGNALS
Commit changes, OTIF, time to detect and resolve, repeat failures.
DECISION & VALUE
Test feasible promise and recovery rules, then feed recurring causes upstream.
EXAMPLE DELIVERABLE FORMATS
-
Promise-to-delivery failure map
-
Exception cockpit and ownership view
-
Repeat-failure learning loop
-
STAGE 03 / PROTOTYPE
“If it only works on paper, it doesn’t work.”
Make a practical version of the response and test it with the people who will use it.
WHAT WE FOCUS ON
-
Prepare the data and workflow for a useful test.
-
Design the technology, process and roles around the change.
-
Test in real work and refine what does not fit.
PRIMARY DELIVERABLE
Prototype and design
A testable response, the learning from it and a design for the next step.
WITH YOUR TEAM
Test the approach together.
THE WORK AND WHAT IT PRODUCES
Prototype offerings
Put a usable version of the idea in front of the people who make the decisions.
RELEVANT DELIVERABLES
-
Testable workflow or tool
-
Feedback and test findings
-
Specify the data, handoffs, controls and roles the new way of working needs.
RELEVANT DELIVERABLES
-
Data and workflow design
-
Ownership and control requirements
-
Turn what the test taught us into the build and adoption decisions that follow.
RELEVANT DELIVERABLES
-
Refined design
-
Implementation requirements
-
STAGE 04 / SUSTAIN
“A plan nobody follows isn’t a plan.”
Put ownership, support and a review rhythm around the change so it can stay in use.
WHAT WE FOCUS ON
-
Decide what should be implemented next.
-
Clarify the owners and changes needed across people, process and technology.
-
Review whether the change continues to help.
PRIMARY DELIVERABLE
Implementation plan
The next work, its owners and how progress will be reviewed.
WITH YOUR TEAM
Choose and commit to the next work.
THE WORK AND WHAT IT PRODUCES
Sustain offerings
Sequence the work and make dependencies, decisions and owners visible.
RELEVANT DELIVERABLES
-
Implementation roadmap
-
Scope and ownership plan
-
Equip the people who will run the new process, tool or decision routine.
RELEVANT DELIVERABLES
-
Role and training plan
-
Support and handover materials
-
Keep the measures and decisions visible after the initial change is put to work.
RELEVANT DELIVERABLES
-
Review cadence
-
Measures and ownership for ongoing use
-